
Stay up to date with the latest developments
Leave your email address and receive the latest developments in software, AI and Mendix.
Leave your email address and receive the latest developments in software, AI and Mendix.
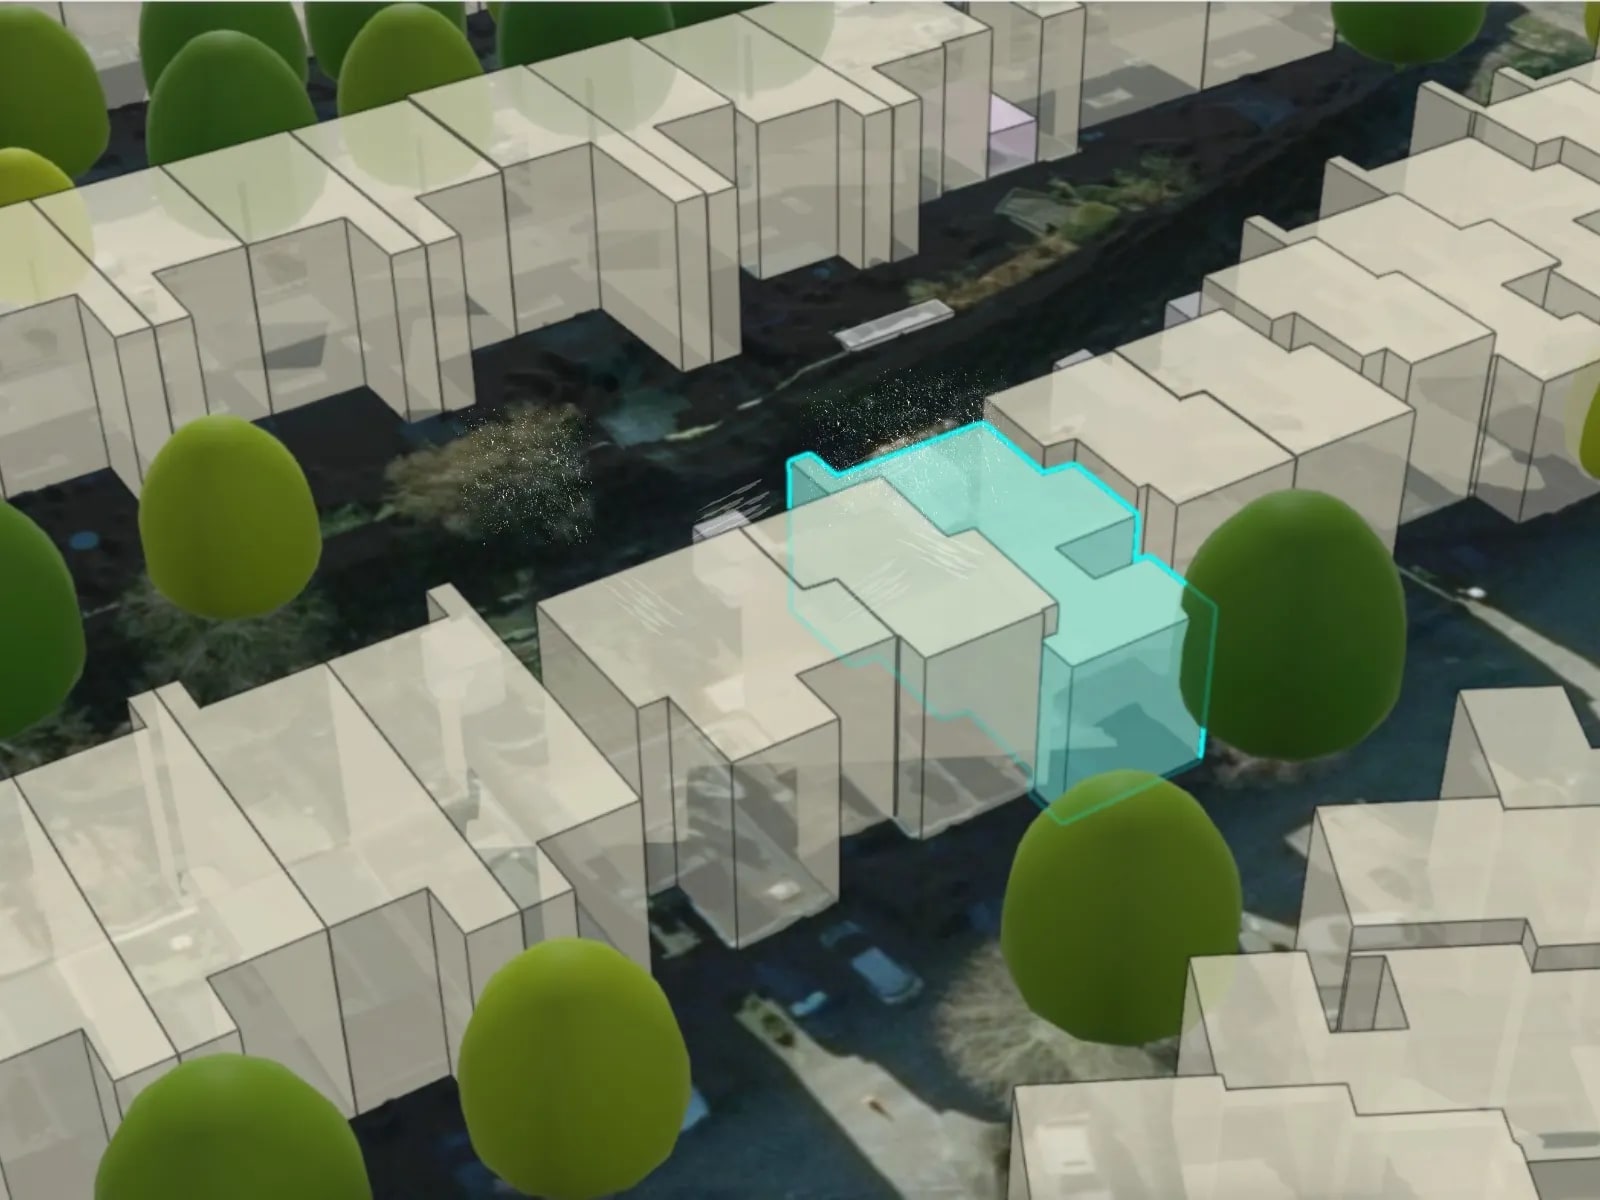
JAM-IT builds bespoke solutions with geodata, interactive maps, geo-fencing, analysis and visualisation for better insight and decision-making.
Many organisations hold large volumes of data, but without context that information stays hard to interpret. Linking data to location adds an extra dimension. On a map you see at a glance what is happening, where it is happening and how different factors relate to each other.
Geo-visualisation makes it possible to optimise routes, analyse objects within an area or combine real-time information with environmental data. That lets organisations recognise patterns faster and make better-founded decisions.
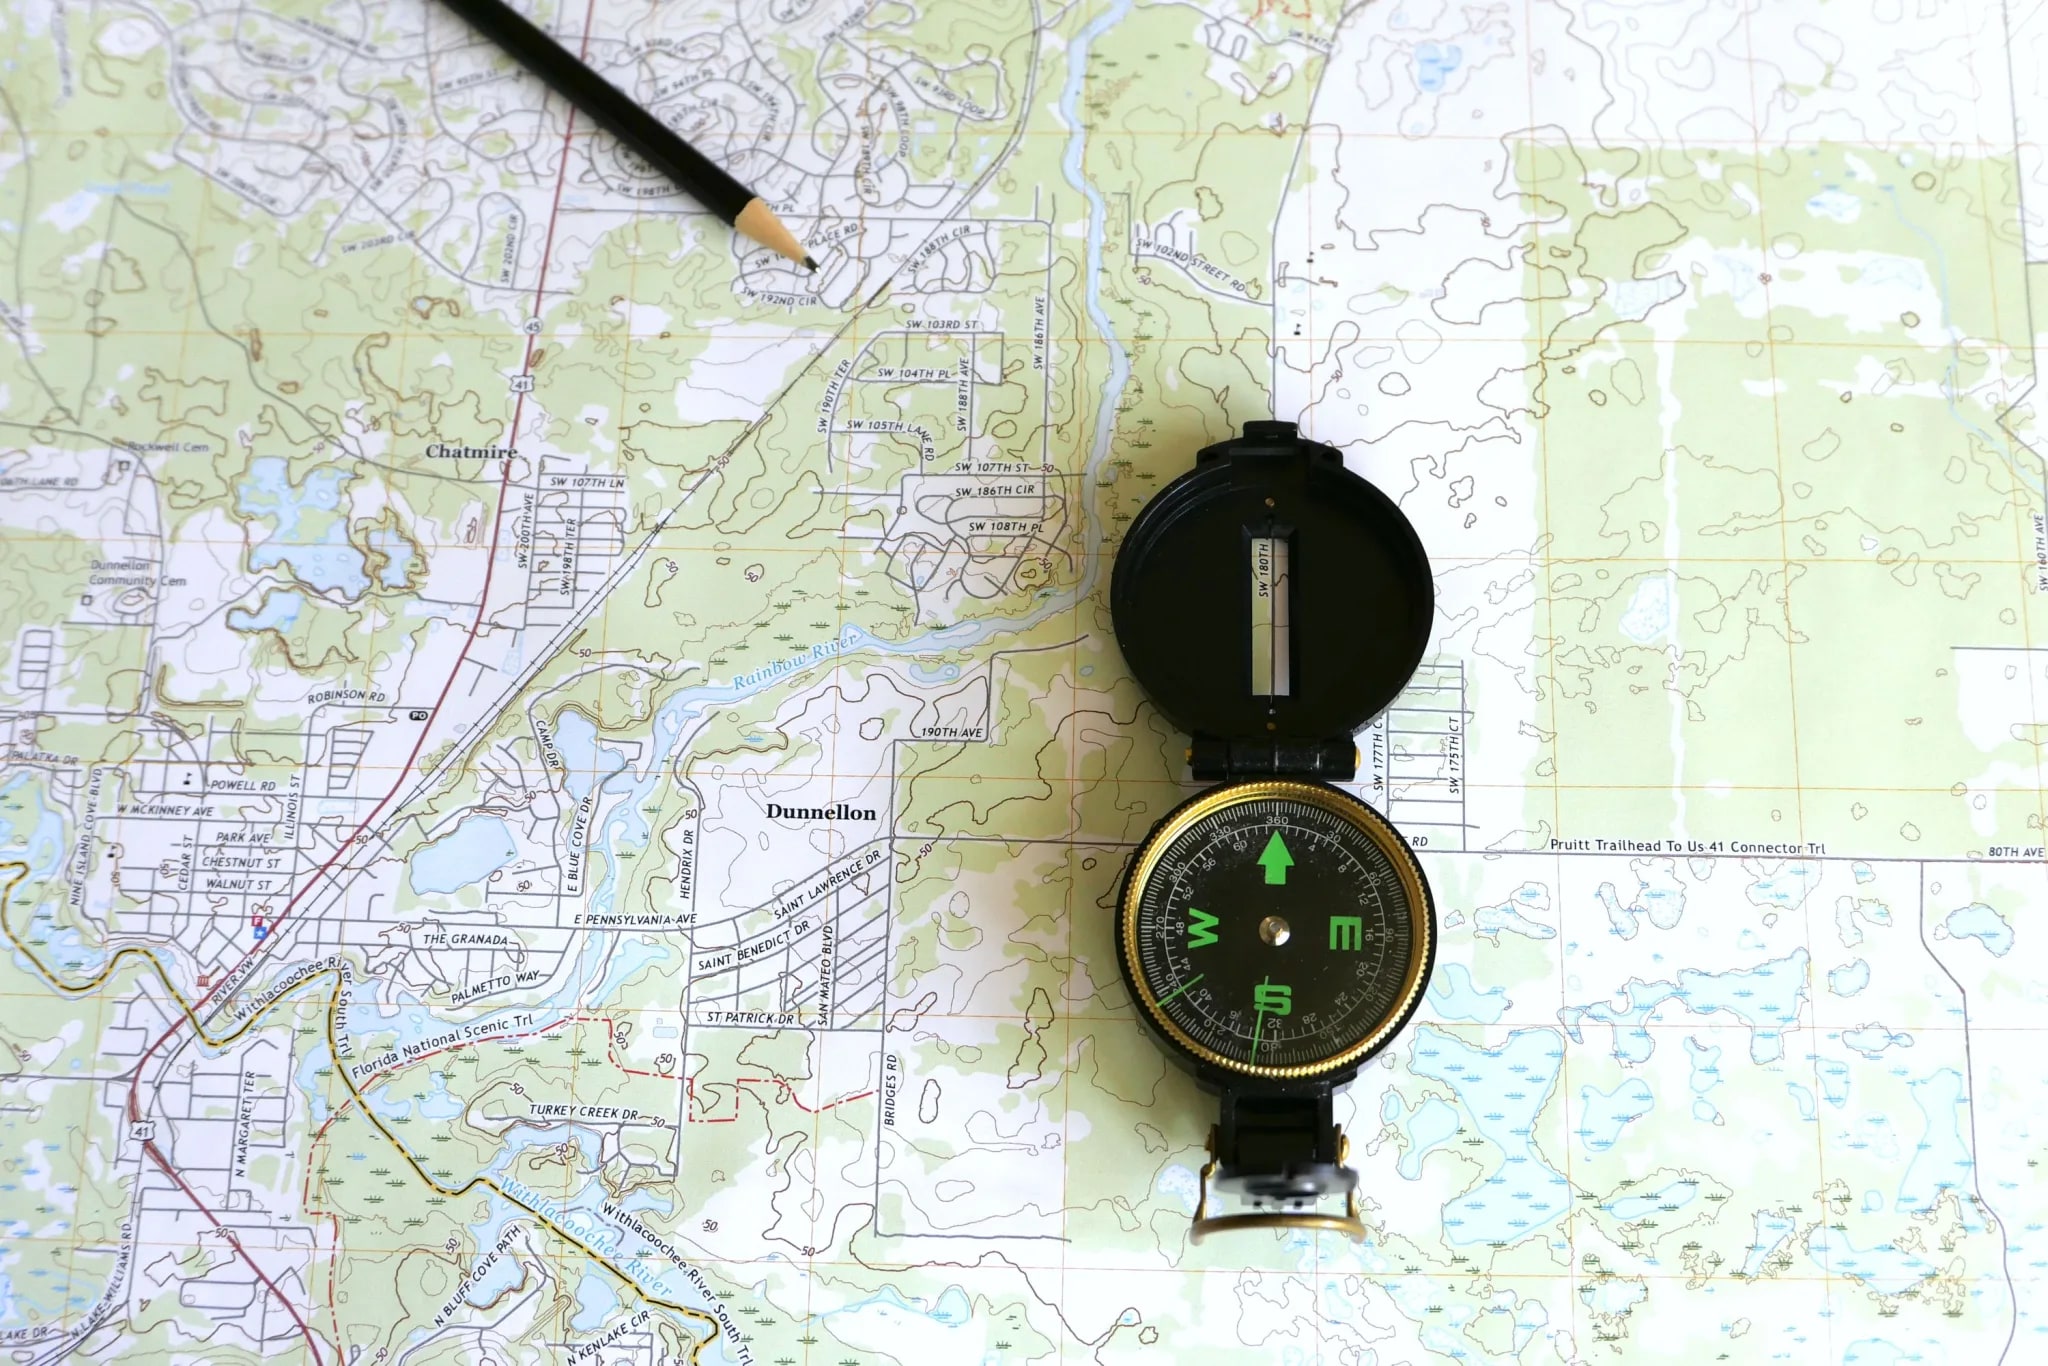
Data contains addresses, coordinates or objects, but without visual context it gives too little overview.
Employees use separate maps or external systems alongside the application they work in.
Distance, travel time, area, accessibility or environmental factors influence the choice that has to be made.
Current data from different sources has to be shown visually in one place.
Relationships between objects, areas and events are hard to spot in tables or separate data sources.
Employees on site and colleagues at the office need the same up-to-date geographic overview.
When location data is used well, a new level of insight into processes and data emerges. That can lead to things like:
Thanks to visual insight.
For example in planning, logistics or incident management.
Of environmental data and patterns.
Because complex data is presented visually and interactively.
For combining different data sources.
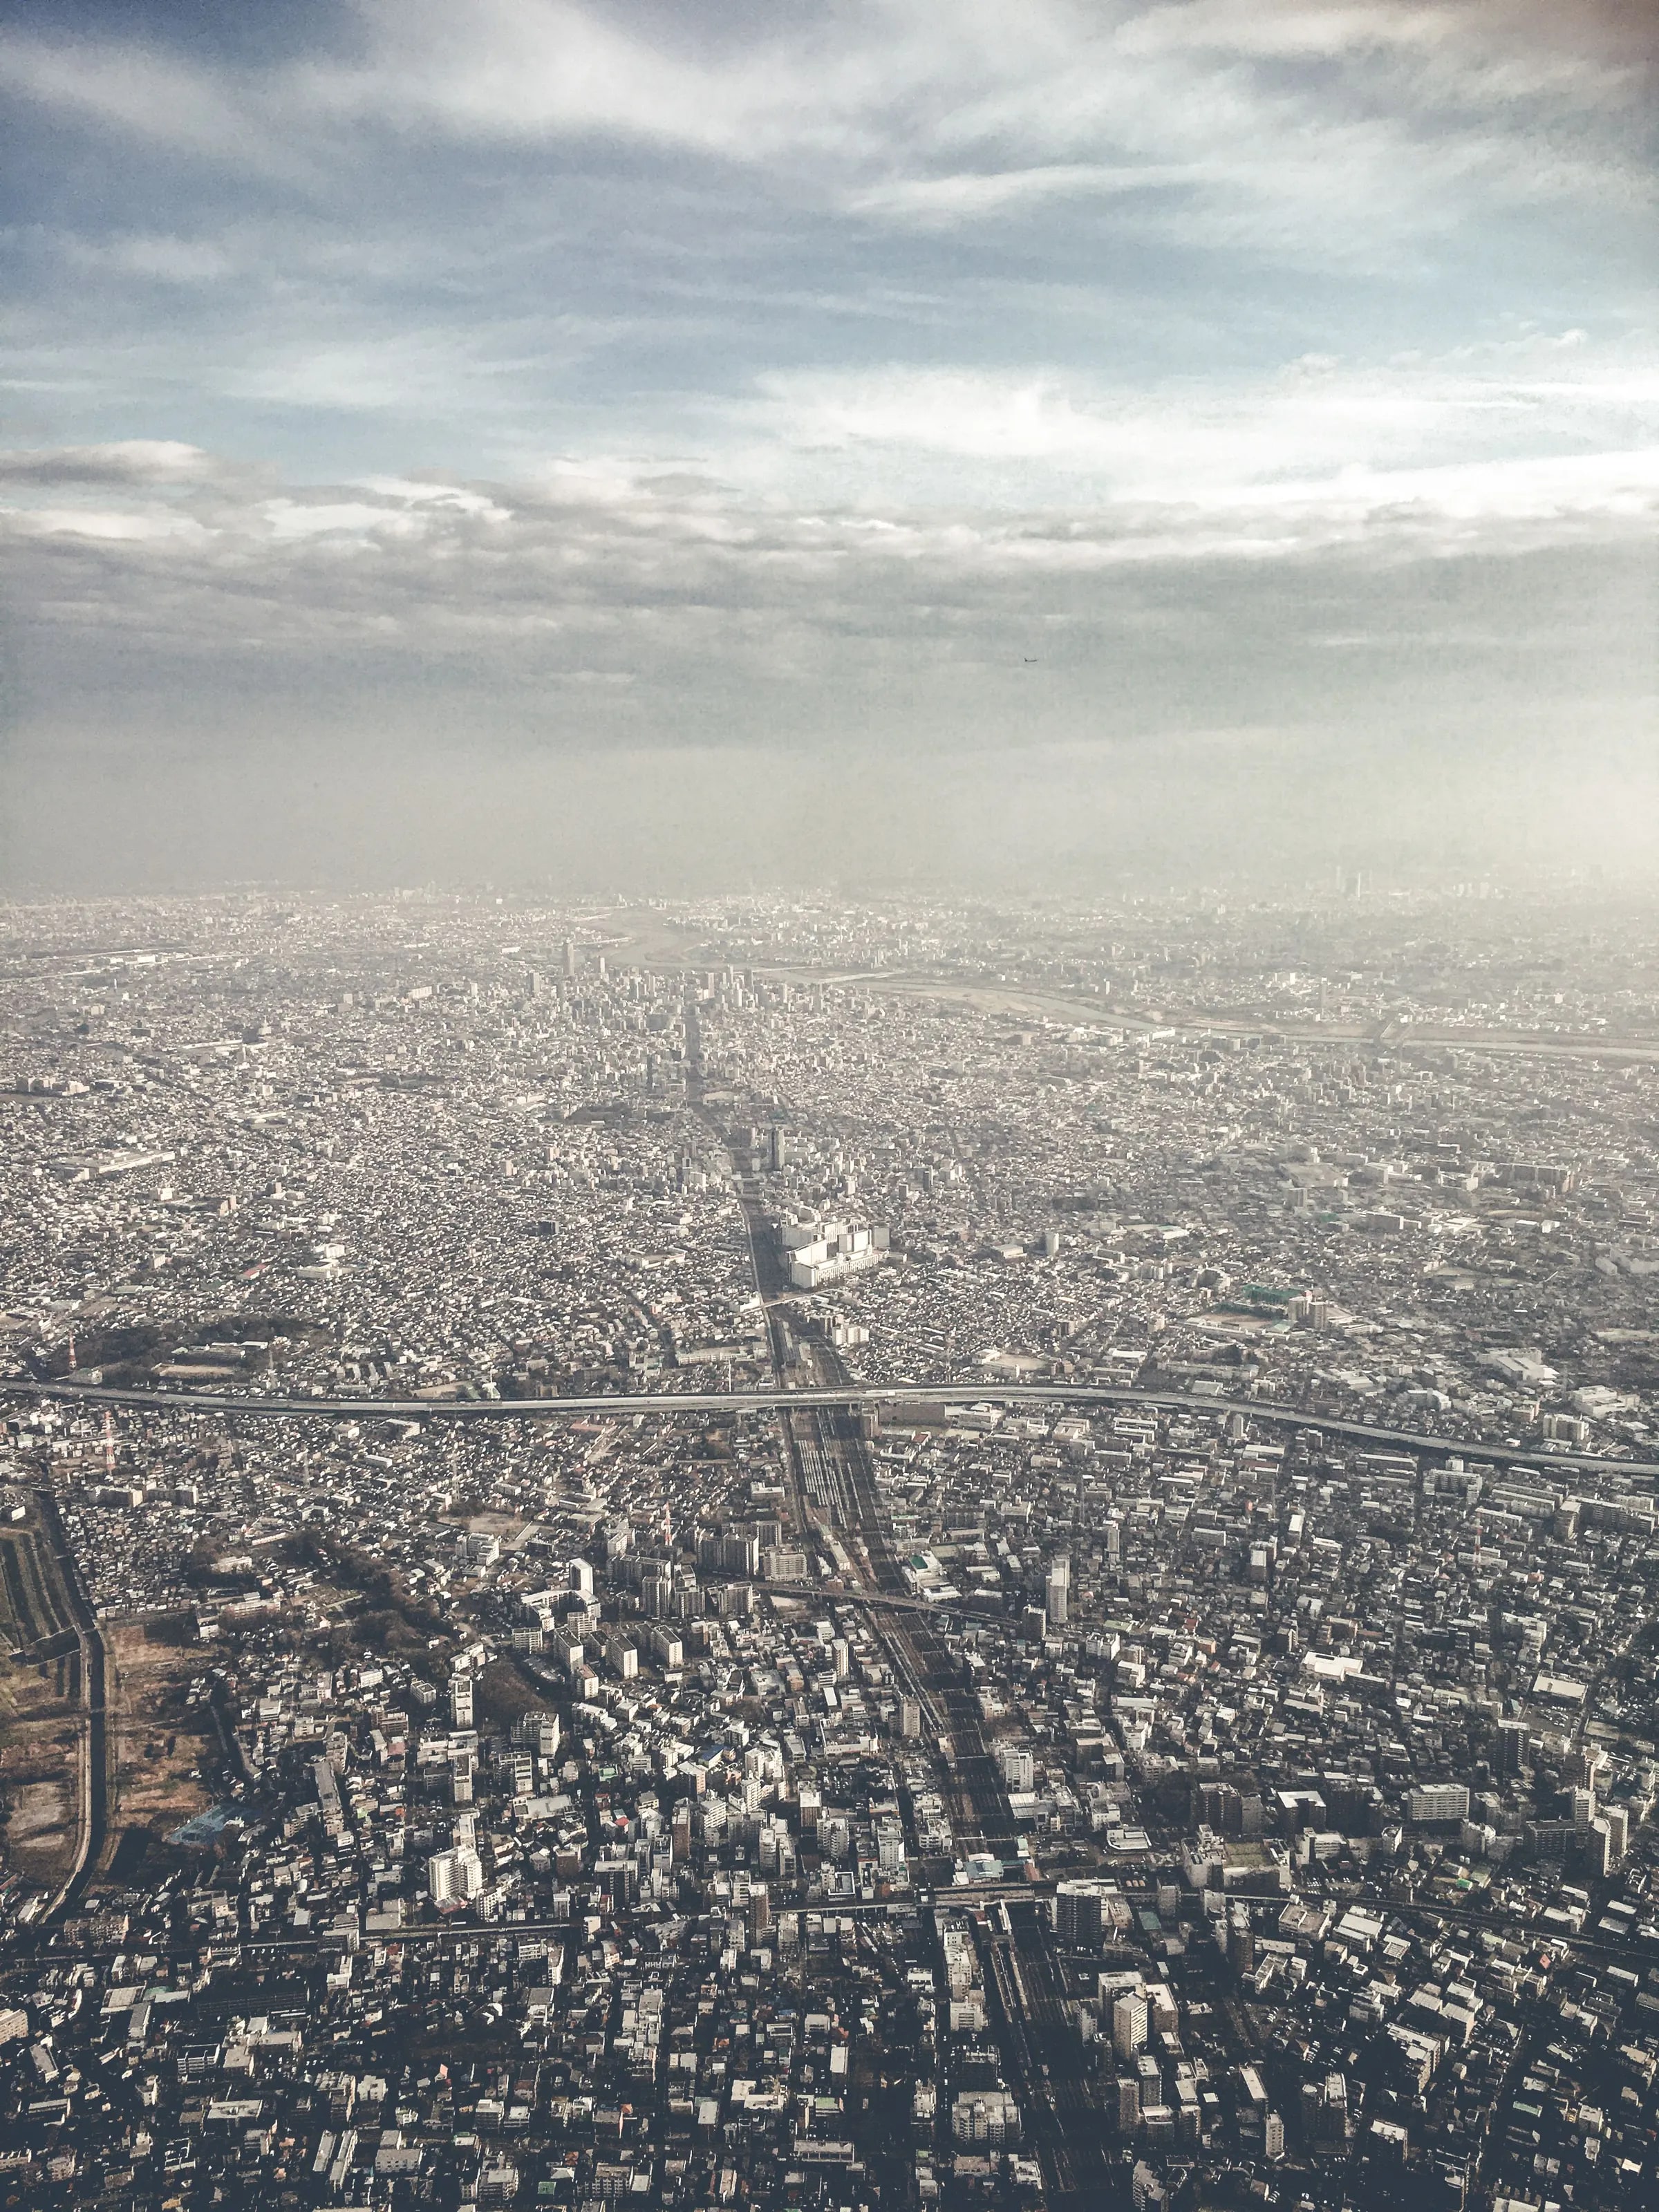
At JAM-IT we build bespoke solutions that fit an organisation's processes and information needs. A few examples of applications:
Many applications work with addresses, coordinates or map positions. We build solutions that translate locations into addresses automatically, or the other way around. A system can, for example, determine an exact address from a map position, or show a location on the map straight from an address.
With geo-fencing a digital area can be defined on a map, for example a circle or a specific shape. An application can then automatically determine whether an object, user or event is inside or outside that area.
Besides showing locations, applications can also perform calculations based on geographic data. A system can analyse what lies within a certain radius, for example. Analyses like these help organisations gain faster insight into risks, opportunities or operational situations.
Sometimes two-dimensional map information is not enough. In that case we can also visualise data in three dimensions, adding height information. Factors such as the position of the sun or environmental influences can be taken into account in visualisations too.
In logistics applications, geodata can be used to optimise routes. That takes account of factors such as distance, travel time, vehicle availability and specific rules or restrictions.
Geo functionality can be part of a wider bespoke application, so that map information fits existing processes, user roles and data sources.
A geo solution does not stand on its own. Location data is combined with existing data and processes, so that users not only see what is happening but can also analyse, decide and act straight away.
Location data plays an ever larger role in how organisations work, analyse and make decisions. At JAM-IT we build bespoke solutions in which geographic data and visualisation come together. From map functionality and route calculations to real-time dashboards and 3D visualisations: we translate complex location data into clear, usable insight.
Geo & visualisation is therefore more than a map on a screen. It is a way to make data understandable and to support processes better.
Whether it is about safety, logistics, infrastructure or public services: visual information based on location makes data immediately understandable and usable. Location and address functionality is often used in logistics systems, reporting apps or mobile applications, and geo functionality can be part of a wider bespoke application. Read more about planning and route optimisation as well.
Geo-visualisation in practice
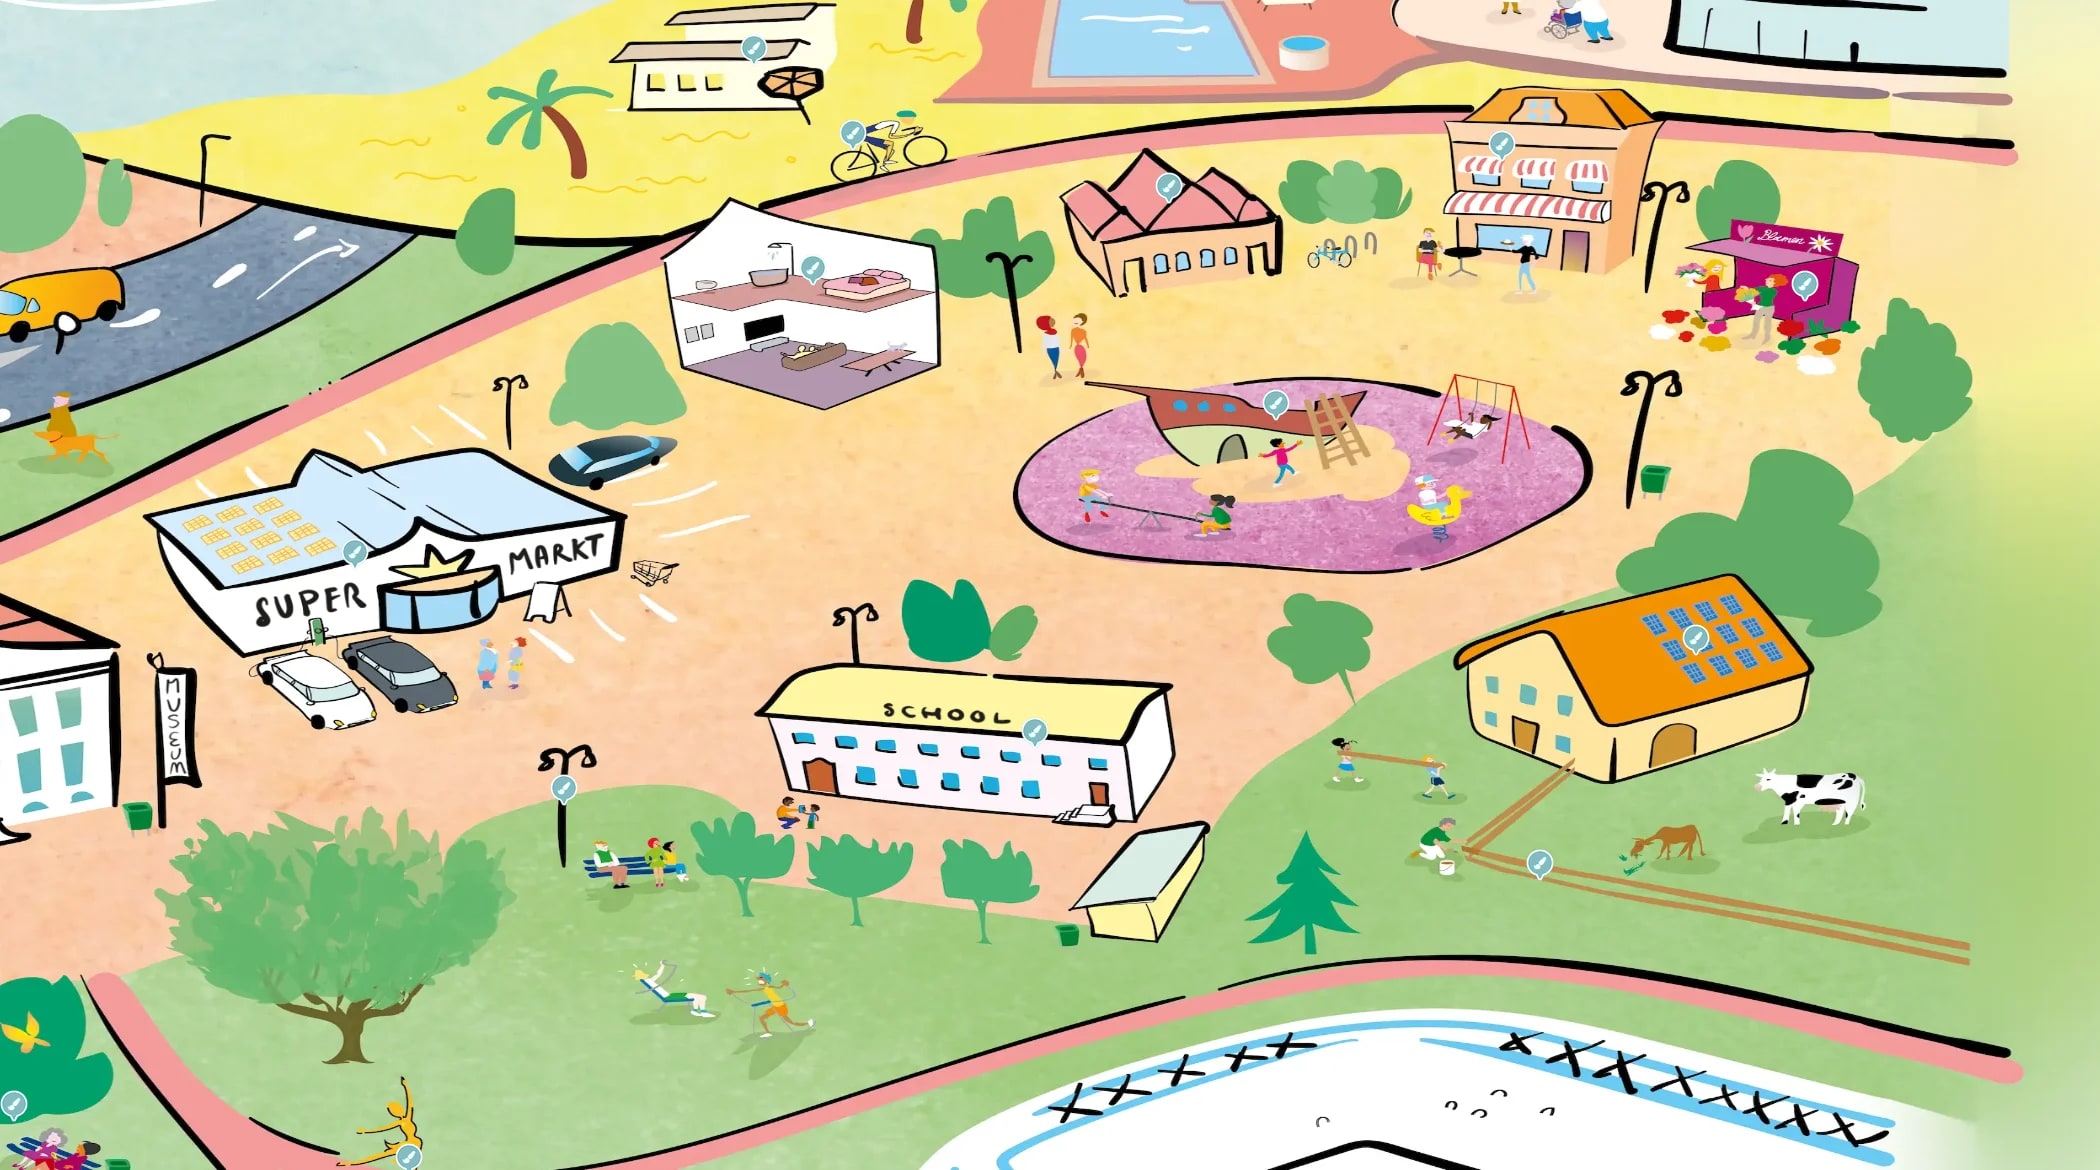
For VVVF, JAM-IT turned an existing static illustration into an interactive map. Users can discover for themselves where and how paint, coatings and printing ink are used.
By adding different layers and interactive elements, a complex story is made visual and accessible for policymakers, stakeholders and the general public. The map is also built up in modules, available in several languages and usable at European level.
Interactive visualisation
A static illustration has been turned into an environment where users can navigate through applications themselves.
Accessible explanation
The map makes a complex industry story understandable for policymakers, stakeholders and the general public.
Scalable and multilingual
The solution can be extended, is available in several languages and is used more widely than the original application.
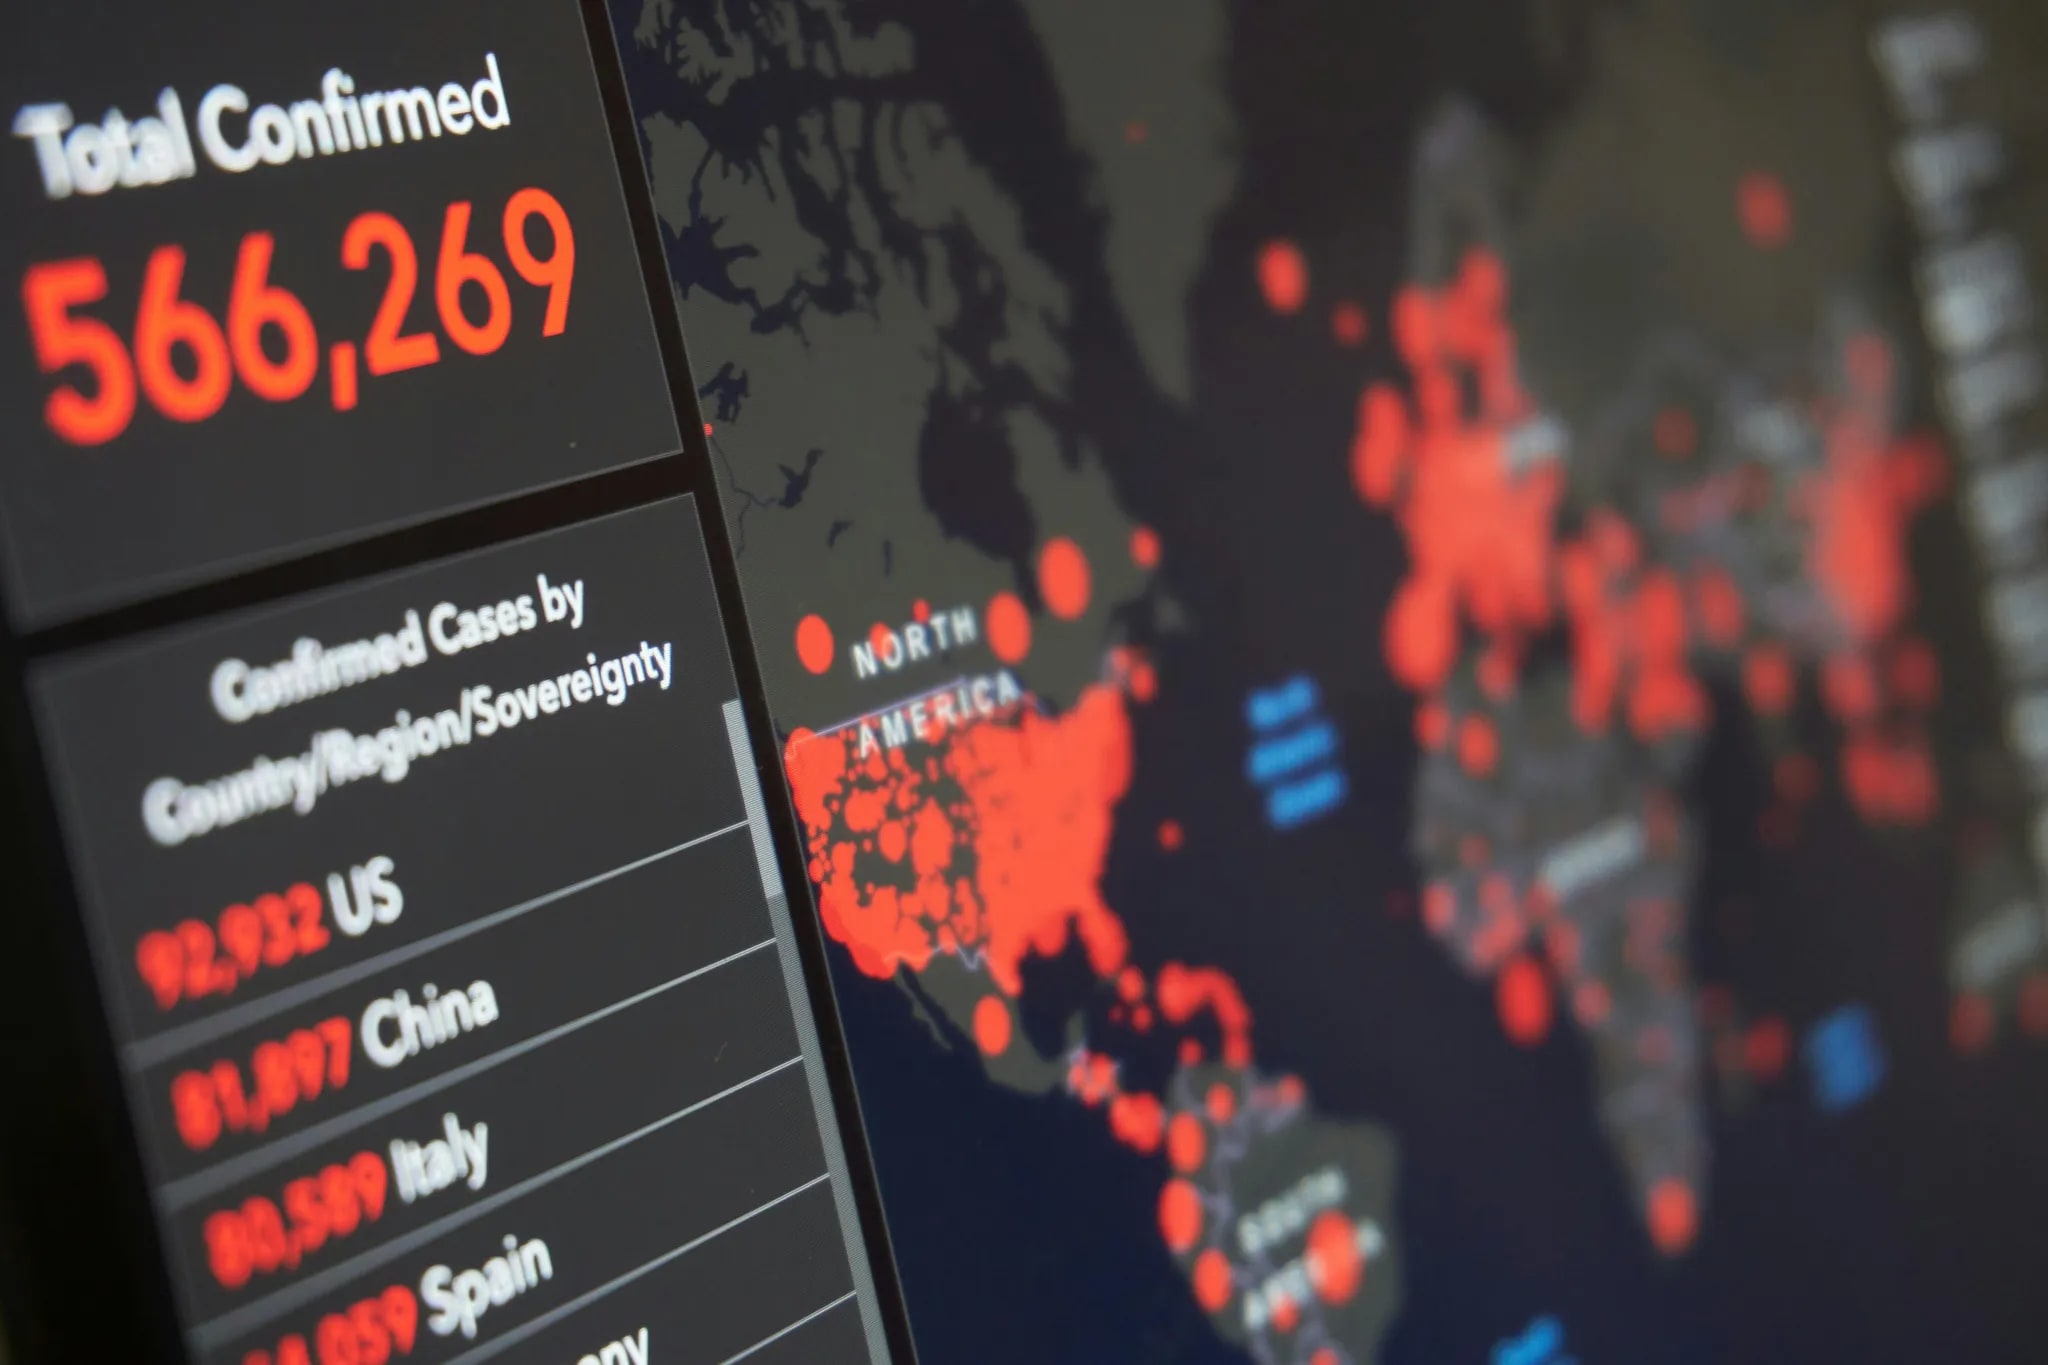
Our geo and visualisation solutions are used in a range of sectors.
Safety
Together with the Multi Intelligence Center we built visualisations that support emergency workers in tackling incidents. Combining real-time data with location information gives a clear overview of the situation.
Information from different sources is brought together and shown visually, so that decisions can be made faster and on a better footing.
Reports
For the reporting app MeldR we built a map-based solution that lets residents easily report nuisance or incidents at a specific location. Reports are linked directly to a point on the map, so enforcement officers see exactly where the problem is.
We also use geo-fencing: digital areas on the map that automatically determine whether a report falls within a given area. Residents can also follow the status of reports on the map.
Logistics
For Transporting Highway we built a logistics platform in which location data plays a central role. Users can enter transport orders by country and city, after which the system automatically calculates the distance between locations using map data.
Based on those calculations, a price indication is generated straight away.
View the Transporting Highway case
Planning
For Mama Taxi we are building a route optimisation system that distributes journeys across the available taxis automatically. Based on location data and various factors, such as distance, available vehicles, drivers' working hours and specific customer requirements, the system works out the most efficient route plan.
That gives a better distribution of journeys, shorter waiting times for customers and more efficient use of vehicles.
Our experts are glad to explore with you how location data, maps and visualisation can fit your processes and information needs.
The investment depends on the application, the volume of data and the integrations with existing systems. In a no-obligation conversation we map out together what is needed and which approach fits.
You have an idea. A process that could be more efficient. Customers who deserve better service. Answer a few questions, leave your details and see a well-founded estimate straight away.
Start the calculatorAnswering the questions takes about 3 minutes.
 Want to know more?Ask Armando
In modern business, streamlining communication, processes and interactions is crucial. At JAM-IT we build bespoke portal...
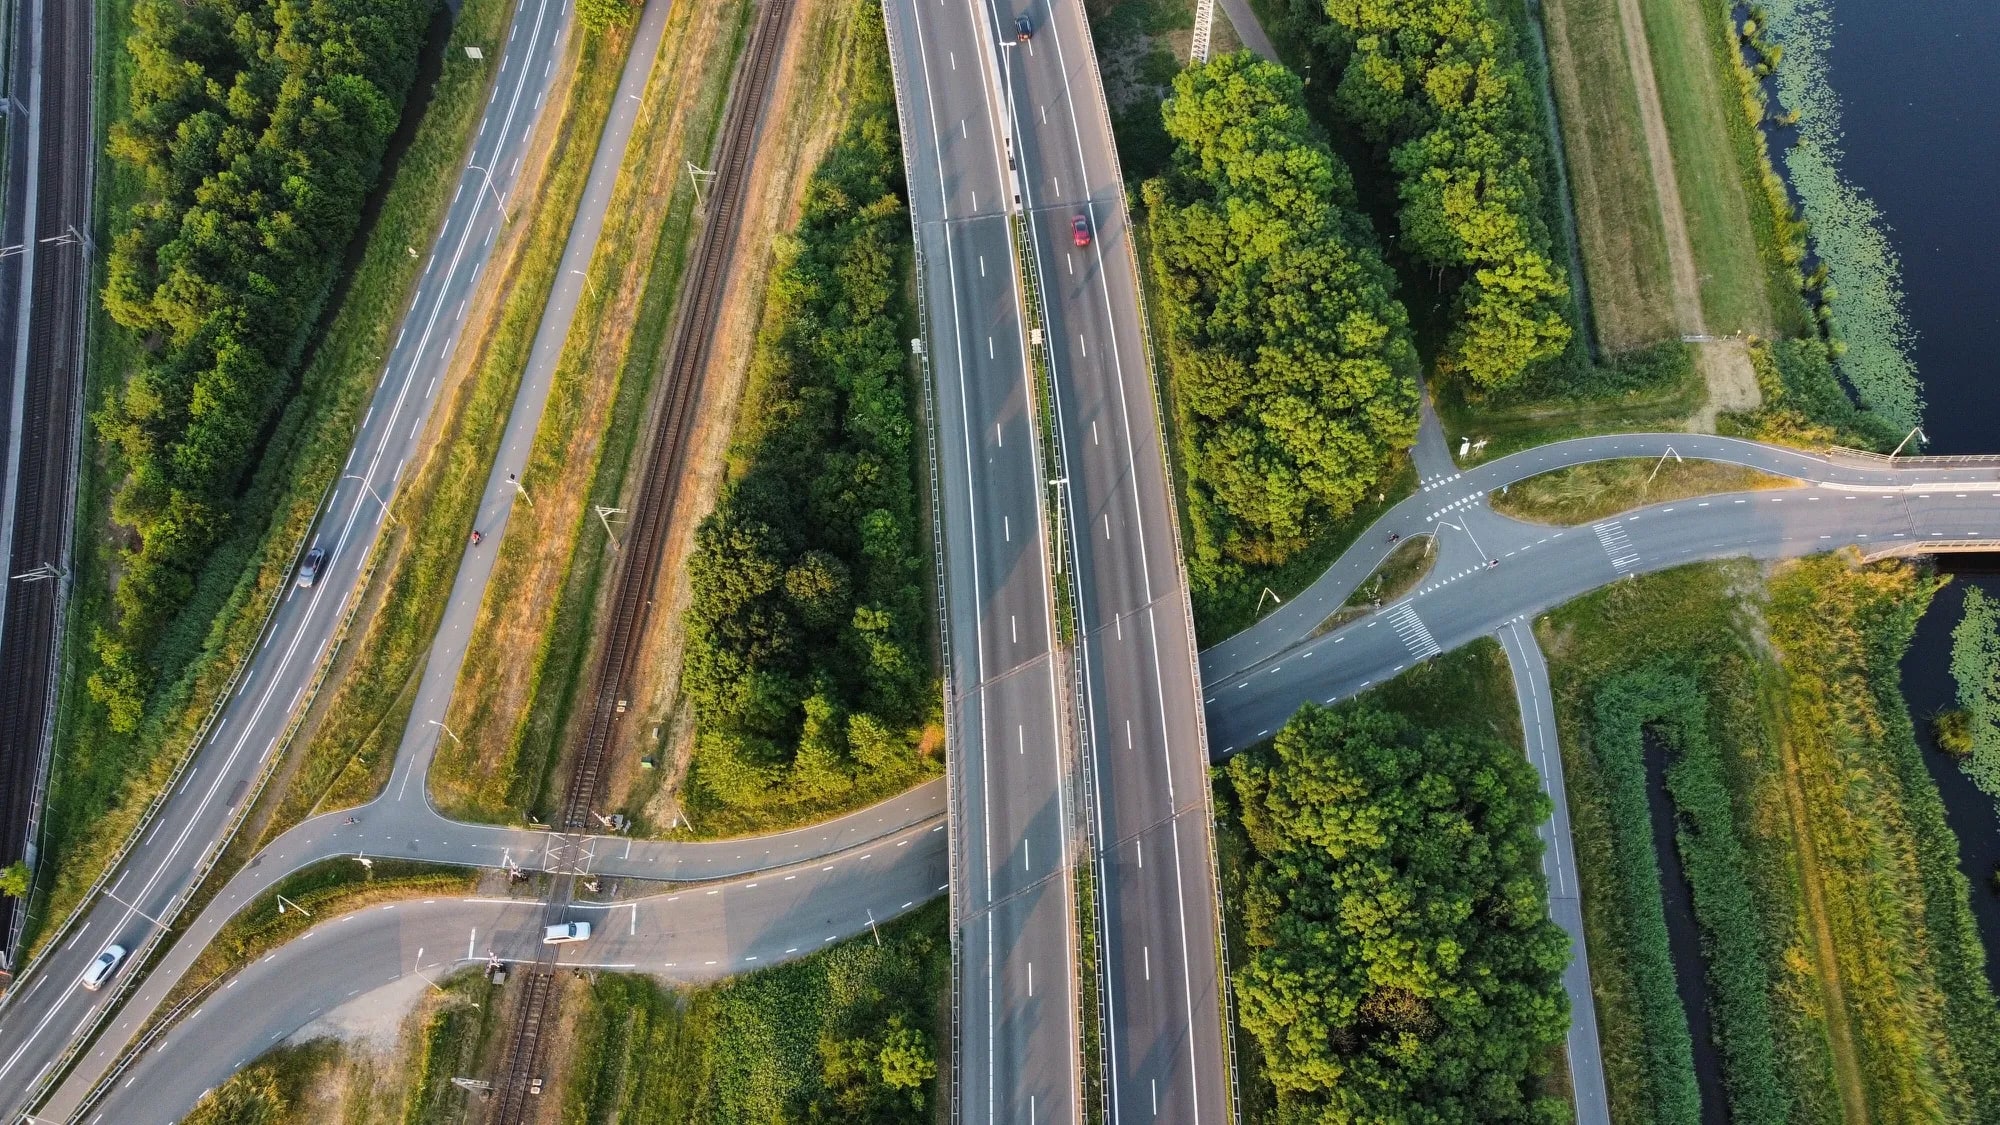
Smarter schedules, more efficient routes and optimal use of people, resources and capacity with bespoke software for pla...

Smart digital questionnaires that connect input, validation, workflows and reporting within bespoke processes.